nf-core-crispriscreen
nf-core/crispriscreen: Output
Introduction
This document describes the output produced by the pipeline. Most of the plots are taken from the MultiQC report, which summarises results at the end of the pipeline.
The directories listed below will be created in the results directory after the pipeline has finished. All paths are relative to the top-level results directory.
Pipeline overview
The pipeline is built using Nextflow and processes data using the following steps:
- Sub-sampling of reads (
Seqtk/sample, optional) - Read QC (
FastQC) - Generic adapter and quality trimming (
Trim Galore!) - Specific primer sequence trimming (
cutadapt) - Preparation of
*.fastalibrary (customRscript) - Alignment using (
Bowtie2)- Build index from
*.fastalibrary - Align reads to library
- Optional filtering by mapping quality
- Build index from
- Count reads per target and input file (
subread/featurecounts) - Quantify gene fitness score from multiple targets per gene
- Option 1: Gene fitness is calculated using
MageckMLE - Option 2: Gene fitness is calculated using
DESeq2
- Option 1: Gene fitness is calculated using
- Generate HTML report with fitness results (
R markdown) - Present QC for raw and mapped reads (
MultiQC)
Seqtk/Sample
Output files
seqtk/*.subsampled.fastq.gz: Subsampled compressedfastq.gzsequencing reads.
Sub-sampling of reads (Seqtk/sample, optional).
FastQC
Output files
fastqc/*_fastqc.html: FastQC report containing quality metrics.*_fastqc.zip: Zip archive containing the FastQC report, tab-delimited data file and plot images.
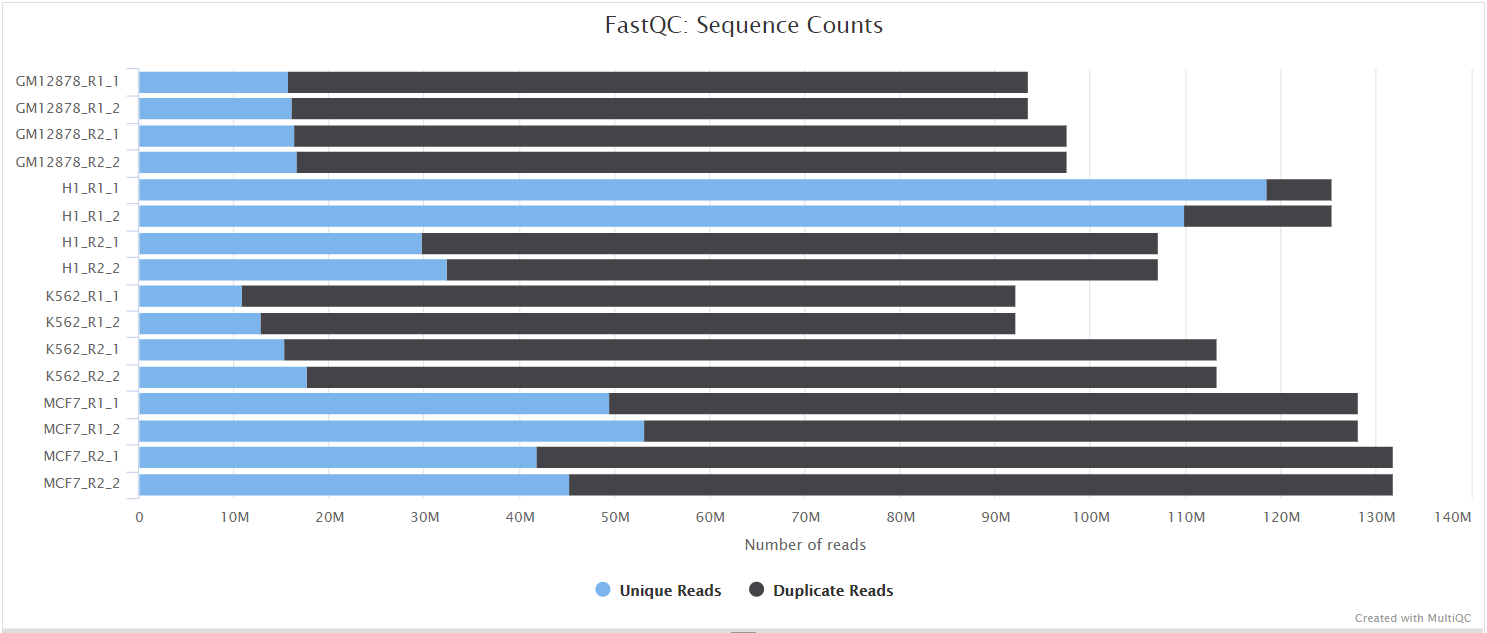
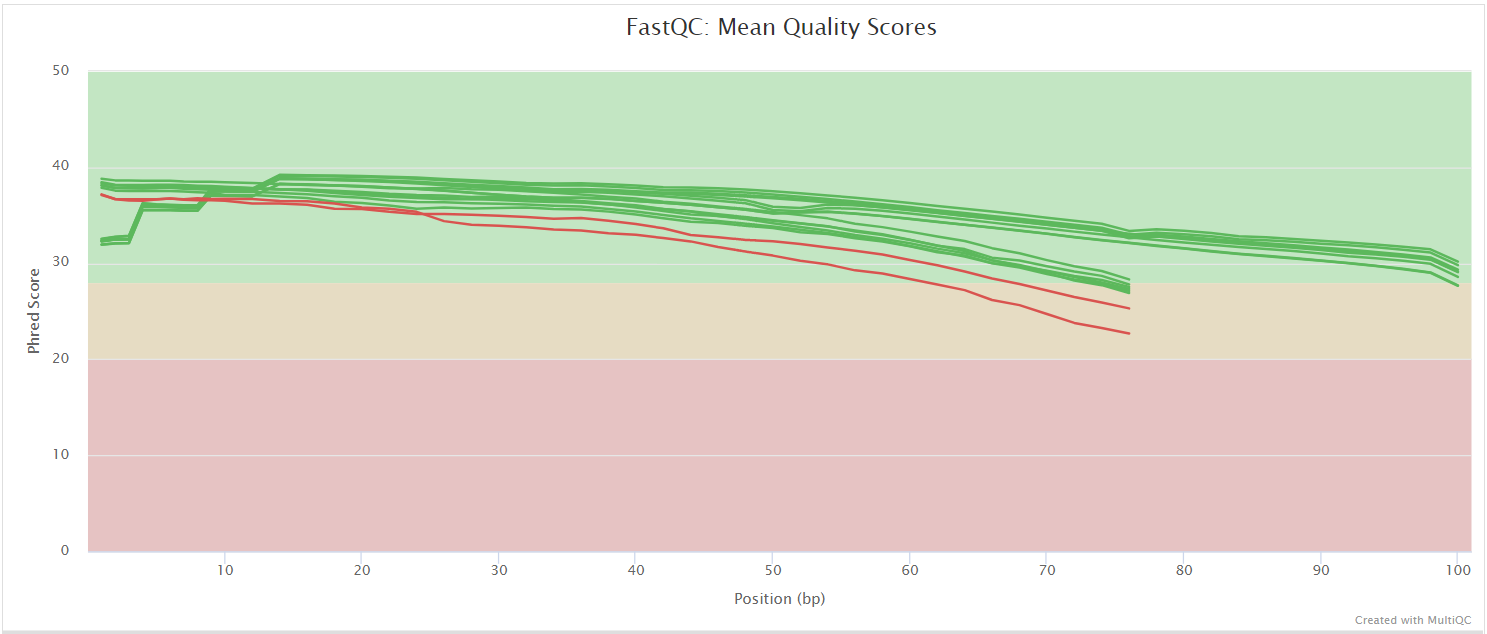
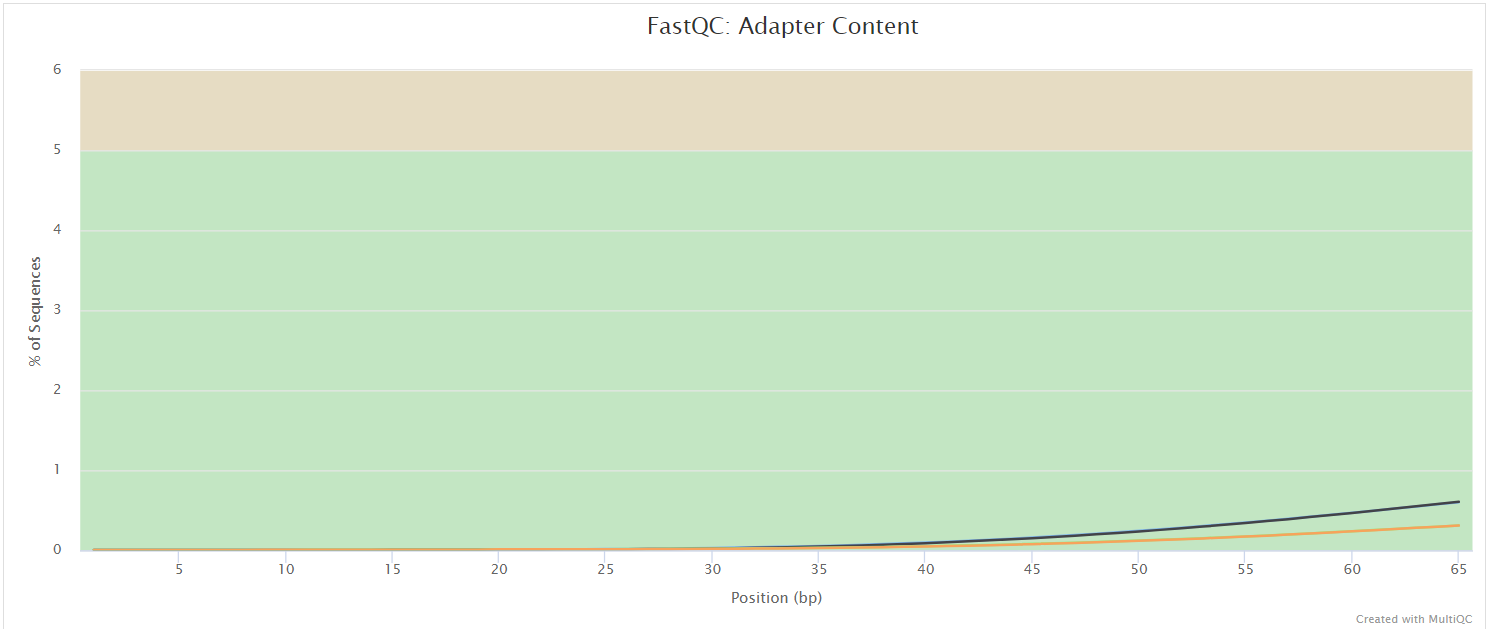
FastQC gives general quality metrics about your sequenced reads. It provides information about the quality score distribution across your reads, per base sequence content (%A/T/G/C), adapter contamination and overrepresented sequences. For further reading and documentation see the FastQC help pages.


:::note The FastQC plots displayed in the MultiQC report shows untrimmed reads. They may contain adapter sequence and potentially regions with low quality. :::
Trimgalore
Output files
trimgalore/*_trimming_report.txt: Report of the trimming results for each*.fastq.gzinput file.
Generic adapter (e.g. Illumina) and quality trimming of reads (Trim Galore!).
Cutadapt
Output files
cutadapt/*_cutadapt.log: Report of the trimming results for each*.fastq.gzinput file.*.trim.fastq.gz: Files with trimmed reads.
Specific primer sequence trimming (cutadapt).
Preparation of *.fasta library
Output files
prepare/*.saf: The input library insafformat converted from the provided.fastafile.*_controls.tsv: Optional table in tab-separated format with overview of control barcodes.
This module generates a .tsv input table from the provided .fasta file.
It also checks if a pattern for control barcodes has been passed with the --gene_controls parameter.
In case a pattern has been supplied but no matching barcodes were found, it stops with an error.
Bowtie2
Output files
bowtie2/bowtie2/*.bt2: Bowtie2 index created from the libary*.fastafile.
bowtie2/*.bam: Compressed sequence alignment files, one per input.fastq.gz.*.bowtie2.log: Bowtie2 log file, one per input.fastq.gz.*.unmapped.fastq.gz: Optionally exported unmapped reads, one per input.fastq.gz.
Bowtie2 is used for mapping reads to the ‘genome’, here the library of guide RNAs/barcodes.
FeatureCounts
Output files
subread/*.txt: Main result of this module, a table with detailed read counts per target (guide RNA/barcode)*.txt.summary: Summary of mapped and unmapped reads.
Summarizes read counts per target and input file, see subread/featurecounts.
This is the input for fitness score calculation with DESeq2.
Mageck
Output files
mageck/all_counts.gene_summary.txt: Table withbetascore,zscore, p-value and false discovery rate for all targeted genes.all_counts.sgrna_summary.txt: Table with overview of sgRNA-gene association and sgRNA efficiency.
DESeq2
Output files
fitness/all_counts.tsv: A summary table with all read counts per target (gene, barcode, sgRNA, …), concatenated from the individual [#featurecounts] output files.result.tsv: Table with fitness scores and other statistics for all conditions in*.tsvformat.result.Rdata: Table with fitness scores and other statistics for all conditions in memory-efficient*.Rdataformat. Can be read intoRusingload("result.Rdata).
A custom R script employing DESeq2 to quantify gene fitness score from multiple targets per gene, reporting different summary statistics. The final output of this module is a table in *.txt and *.Rdata format with the following columns:
| Column | Type | Example | Comment |
|---|---|---|---|
| sgRNA | chr |
aat_111 |
name of sgRNA as in .fasta reference |
| sgRNA_target | chr |
aat |
name of sgRNA target gene |
| sgRNA_position | numeric |
111 | position of sgRNA relative to target start |
| condition | chr |
example |
experimental condition |
| date | chr |
2021_01_09 |
experiment date |
| time | numeric |
0 | time / n generations, important for fitness calculation |
| group | numeric |
1 | group number for sample |
| reference_group | numeric |
1 | group number of reference for comparison |
| baseMean | numeric |
NA |
DESeq2 average number of reads for sgRNA |
| log2FoldChange | numeric |
0 | DESeq2 log2 FC for sgRNA |
| lfcSE | numeric |
0 | DESeq2 log2 FC error for sgRNA |
| stat | numeric |
NA |
DESeq2 t statistic for sgRNA |
| pvalue | numeric |
1 | DESeq2 p-value for sgRNA |
| padj | numeric |
1 | DESeq2 adjusted p-value for sgRNA |
| fitness | numeric |
2.020183 | fitness for sgRNA |
| sgRNA_index | numeric |
4 | relative position of sgRNA |
| sgRNA_correlation | numeric |
0.6247412 | correlation of sgRNA with others |
| sgRNA_efficiency | numeric |
0.9893041 | relative repression efficiency of sgRNA |
| wmean_log2FoldChange | numeric |
0 | weighted mean log2 FC for gene |
| sd_log2FoldChange | numeric |
0 | standard deviation of log2 FC for gene |
| wmean_fitness | numeric |
1.777574 | weighted mean fitness for gene |
| sd_fitness | numeric |
0.9558989 | standard dev of fitness for gene |
| p_fitness | numeric |
0.001 | p-value from Wilcoxon rank sum test (Null: fitness ~ 0) |
| p_fitness_adj | numeric |
0.0001 | p-value from Wilcoxon test, Benjamini-Hochberg adjusted |
| comb_score | numeric |
0.0001 | combined score (-log10(p-value) * abs(wmean_fitness) |
R markdown report
Output files
fitness_report/counts_summary.nb.html: HTML report with information about all samples and read counts.fitness_summary.nb.html: HTML report with information about fitness scores for all conditions.svg/png/pdf/: sub folders with exported figures in SVG, PNG and PDF formatcsv: sub folder with additional tables created duing the reporting stage
Custom R markdown templates are used to render two HTML reports with information about all samples, their number of mapped reads, barcodes, genes, fitness scores, and other information. If fitness calculation is omitted through the option gene_fitness = false in the call to nextflow run ..., only the first report is written. The same applies for having less than two time points in the samplesheet.csv table.
MultiQC
Output files
multiqc/multiqc_report.html: a standalone HTML file that can be viewed in your web browser.multiqc_data/: directory containing parsed statistics from the different tools used in the pipeline.multiqc_plots/: directory containing static images from the report in various formats.
MultiQC is a visualization tool that generates a single HTML report summarising all samples in your project. Most of the pipeline QC results are visualised in the report and further statistics are available in the report data directory.
Results generated by MultiQC collate pipeline QC from supported tools e.g. FastQC. The pipeline has special steps which also allow the software versions to be reported in the MultiQC output for future traceability. For more information about how to use MultiQC reports, see http://multiqc.info.
Pipeline information
Output files
pipeline_info/- Reports generated by Nextflow:
execution_report.html,execution_timeline.html,execution_trace.txtandpipeline_dag.dot/pipeline_dag.svg. - Reports generated by the pipeline:
pipeline_report.html,pipeline_report.txtandsoftware_versions.yml. Thepipeline_report*files will only be present if the--email/--email_on_failparameter’s are used when running the pipeline. - Reformatted samplesheet files used as input to the pipeline:
samplesheet.valid.csv. - Parameters used by the pipeline run:
params.json.
- Reports generated by Nextflow:
Nextflow provides excellent functionality for generating various reports relevant to the running and execution of the pipeline. This will allow you to troubleshoot errors with the running of the pipeline, and also provide you with other information such as launch commands, run times and resource usage.